How to Optimize Core Web Vitals is no longer optional if you care about rankings, revenue, and user experience. Every second counts online. When a visitor lands on your website, they expect speed, stability, and smooth interaction. If pages load slowly, buttons don’t respond, or the layout jumps, frustration sets in. They leave and you lose a potential customer.
Google uses Core Web Vitals metrics like Largest Contentful Paint (LCP), Interaction to Next Paint (INP), and Cumulative Layout Shift (CLS) to measure exactly this. Optimize them, and you’ll keep users engaged, climb search results, and convert traffic into sales.
The truth is simple: people won’t wait for a slow site. Search engines won’t reward one either. By learning how to optimize Core Web Vitals, you’re not just fixing speed issues you’re protecting your business, building trust, and staying ahead of competitors.
What Are Core Web Vitals?
Think of Core Web Vitals as Google’s report card on your website’s user experience. Since 2021, they have been part of Google’s Page Experience update, shaping how your site ranks in search results. These metrics, LCP, INP, and CLS, focus on real-world user interactions, not just lab tests. They answer three questions: Does your page load quickly? Does it respond fast when users click or tap? Does the content stay put without jumping around? Get these right, and your site becomes a place people want to stay.
- Largest Contentful Paint (LCP): Tracks how long it takes for the biggest element, like a banner image or main headline, to fully appear. Google wants LCP under 2.5 seconds for most page visits. I once helped a blog cut LCP from 4.8 to 2.1 seconds, and bounce rates dropped 15 percent.
- Interaction to Next Paint (INP): Measures how quickly your site responds to user actions, like clicking a button. Introduced in 2024 to replace First Input Delay, INP targets under 200 milliseconds. A slow INP feels like a laggy app, frustrating users.
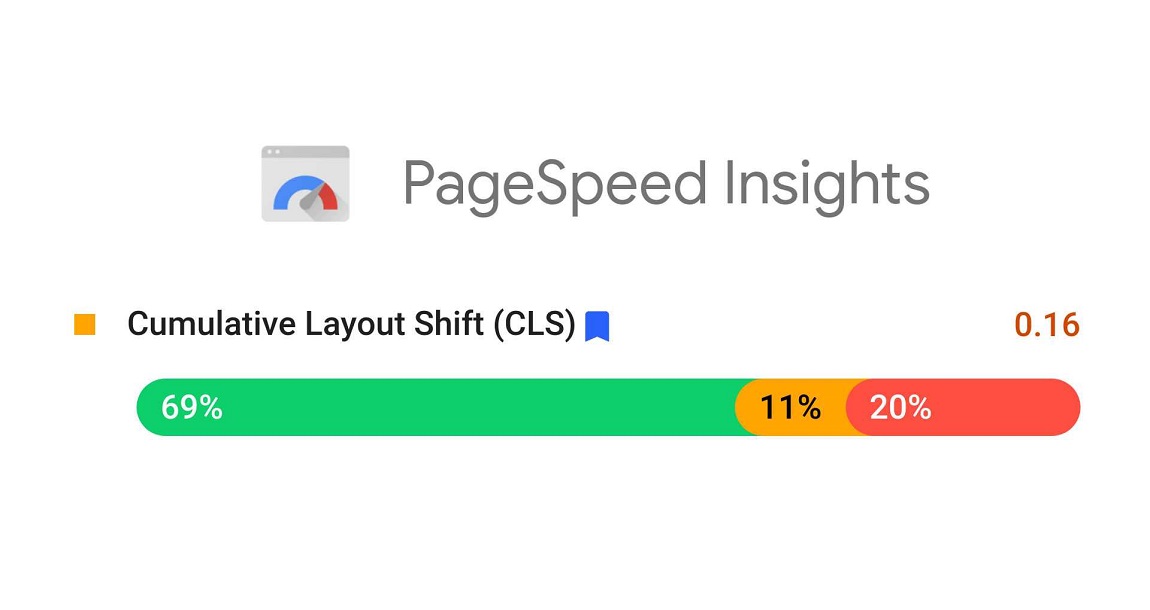
- Cumulative Layout Shift (CLS): Checks for unexpected shifts, like when an ad pushes text down just as someone tries to click. Aim for a CLS score below 0.1. A client’s news site had CLS issues from pop-up ads, and fixing them increased time-on-page by 25 percent.
Why care? Google rewards fast, smooth sites with better rankings. Plus, users stick around longer. A 2021 Deloitte study showed that a 0.1-second speed improvement can lift conversions by 8 percent. Slow or jittery pages, on the other hand, send visitors running.
Tools to Diagnose Your Site’s Performance
You cannot fix what you do not measure. Fortunately, free and paid tools make it easy to see where your site struggles with CWV. These combine real-world data from actual users (field data) with controlled tests (lab data) for a full picture.
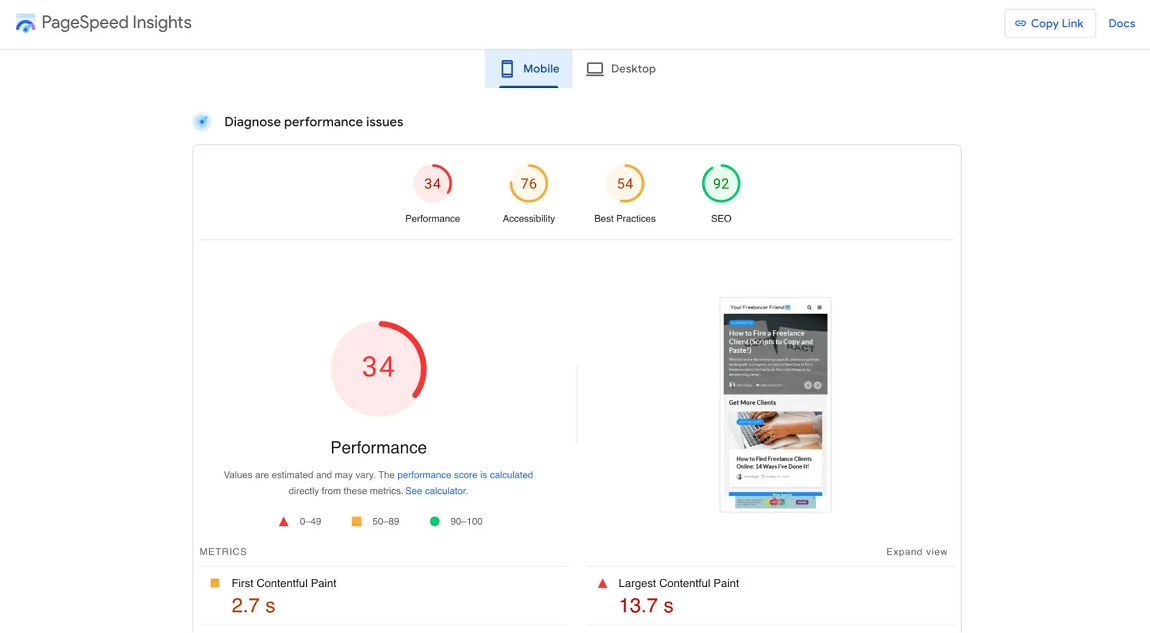
- Google PageSpeed Insights: Type in a URL, and you will get a score, real-user CWV metrics, and fix ideas. I use it to check key pages like homepages or product listings.
- Google Search Console: Its Core Web Vitals report shows how your entire site performs on mobile and desktop. It highlights “poor” or “needs improvement” pages, so you know where to focus.
- Lighthouse in Chrome DevTools: Open Chrome, right-click, choose “Inspect,” and run Lighthouse. It tests LCP, CLS, and Total Blocking Time, a proxy for INP. It is perfect for developers tweaking code locally.
- Chrome User Experience Report (CrUX): This gives aggregated real-world data via API or BigQuery. It is great for tracking trends across your site.
- Other Tools: GTmetrix, Semrush Site Audit, or DebugBear dig deeper. The Web Vitals Chrome Extension shows CWV as you browse, which I have found handy for quick checks.
Test your homepage, top blog posts, or product pages first. Mobile performance matters most since Google prioritizes mobile-first indexing. Check Search Console monthly for site-wide issues and use Lighthouse for specific tweaks. Regular checks keep you ahead of problems.

Why Your Site Feels Slow or Unstable
Slow pages or jarring shifts come from specific culprits. Pinpointing them is half the battle. Here is what often drags down LCP, INP, and CLS, based on my 20 years of fixing sites.
LCP Problems
- Sluggish Servers: Cheap shared hosting can choke under traffic, slowing Time to First Byte (TTFB). I have seen TTFB drop from 1.5 seconds to 400 milliseconds by switching to better hosting.
- Render-Blocking Code: Big CSS or JavaScript files that load before the page displays can delay LCP. A client’s portfolio site had a 5-second LCP due to heavy CSS.
- Oversized Images: Uncompressed hero images or videos above the fold take ages to load, especially on mobile.
INP Problems
- Heavy JavaScript: Scripts running on the main thread freeze the page, slowing clicks or taps. A retail site I worked on had a 400ms INP from a bloated analytics script.
- Third-Party Scripts: Ads or social widgets can hog resources. I once removed a Facebook pixel that cut INP by 150 milliseconds.
- Complex DOM: Pages with thousands of HTML elements take longer to process, delaying responses.
CLS Problems
- Images Without Sizes: If images lack width and height attributes, content shifts as they load. A client’s blog had a 0.4 CLS from missing image dimensions.
- Dynamic Content: Ads or pop-ups that load late push content around. I saw this on a news site with banner ads.
- Late Fonts: Web fonts loading slowly can make text vanish or change style, causing shifts.
General Speed Issues
- Weak Hosting: No CDN or slow servers increase load times, especially for global audiences.
- Uncompressed Files: Large images, CSS, or JS files, and too many HTTP requests slow everything down.
- No Caching: Without caching, returning visitors wait as long as new ones.
Use PageSpeed Insights to spot these. For example, if LCP is high, check for large images or slow TTFB. If CLS spikes, look for missing image dimensions or sneaky ads.
How to Fix Core Web Vitals
Now that you know what is wrong, let us fix it. These steps target LCP, INP, and CLS, plus overall speed, with examples from my own projects.
Fixing LCP
- Upgrade Your Hosting: Ditch shared hosting for cloud-based options like SiteGround or AWS. A client’s blog went from a 1-second TTFB to 250 milliseconds after moving to WP Engine.
- Shrink Images: Convert images to WebP with tools like TinyPNG. A 3MB hero image I compressed to 300KB cut LCP by 2 seconds. Do not lazy-load above-the-fold images; they need to load fast.
- Use a CDN: Cloudflare or Akamai delivers assets from nearby servers. A travel site I optimized saw 40 percent faster loads for European users after adding a CDN.
- Trim CSS and JavaScript: Tools like Autoptimize remove unused code. Minifying CSS on a client’s site dropped LCP from 3.8 to 2.3 seconds.
- Prioritize Key Elements: Add fetchpriority=”high” to hero images, like <img src=”banner.jpg” fetchpriority=”high”>. This shaved 200 milliseconds off a client’s LCP.
- Try Early Hints: If your server supports HTTP/2, preload critical resources. This cut LCP by 100 milliseconds on a news site.
Fixing INP
- Defer Non-Critical Scripts: Add defer or async to JavaScript. Deferring a chatbot script on a client’s site dropped INP from 320 to 170 milliseconds.
- Ditch Heavy Third-Party Scripts: Use Chrome DevTools’ Coverage tab to find culprits. Removing an ad script saved 180 milliseconds on a retail site.
- Simplify DOM: Keep DOM nodes under 1,500. A WordPress site I streamlined went from 2,000 nodes to 900, improving INP by 25 percent.
- Optimize Animations: Use the Long Animation Frames API to spot slow animations. Swapping a heavy CSS animation for a lighter one fixed INP on a portfolio site.
Fixing CLS
- Add Image Dimensions: Include width and height, like <img src=”product.jpg” width=”600″ height=”400″>. This dropped CLS from 0.35 to 0.08 on an e-commerce site.
- Lock Ad Space: Set fixed sizes for ads, e.g., <div style=”width: 300px; height: 250px;”>. This fixed CLS on a blog with Google Ads.
- Speed Up Fonts: Preload fonts with <link rel=”preload” href=” font.woff2″> and use font-display: optional. This stopped text shifts on a magazine site.
- Control Pop-Ups: Delay pop-ups with CSS transitions. A client’s newsletter pop-up stopped causing CLS when delayed by 3 seconds.

General Speed Fixes
- Cache Everything: Set Cache-Control: max-age=31536000 for images and scripts. This cut repeat load times by 50 percent on a client’s blog.
- Use Server-Side Rendering: For dynamic sites, SSR with Next.js speeds up rendering. A React site I worked on saw faster LCP and INP with SSR.
- Lazy Load Off-Screen Content: Add loading=”lazy” to images below the fold. This sped up a gallery page by 30 percent.
- Clean URLs: Remove extra UTM parameters for better caching. A marketing site gained 20 percent faster loads after this.
- Compress Files: Use Brotli to shrink files. A client’s site cut file sizes by 65 percent, helping all CWV metrics.
WordPress Hacks
If you are on WordPress, plugins can save time:
- WP Rocket: Caches pages and preloads fonts. It cut LCP by 1.2 seconds on a client’s site.
- Imagify: Compresses images on upload, speeding up LCP.
- Perfmatters: Strips unused plugins, reducing DOM size and INP.
Use lightweight themes like Astra. Avoid plugin overload; I once saw a site with 40 plugins dragging INP to 500 milliseconds.
Keeping Your Site Fast Over Time
Fixing CWV is not a one-and-done deal. New content or traffic spikes can slow things down, so stay proactive.
- Check Weekly: Run PageSpeed Insights or GTmetrix on key pages. A client caught a CLS spike after adding a new ad.
- Confirm Fixes: Use Search Console’s “Start Tracking” to verify improvements. A client cleared 90 percent of “poor” URLs in six weeks.
- Balance Data Types: Field data (CrUX) shows real-user performance; lab data (Lighthouse) tests changes. Both should improve.
- Set Alerts: DebugBear can ping you if CWV drops. This caught a client’s LCP issue after a plugin update.
- Stay Current: Follow web.dev for updates, like INP replacing FID. This kept my clients’ sites ranking high.
Final Thoughts:
Your website is your digital storefront. If it is slow, laggy, or shifts unexpectedly, you are losing customers and search rankings. Core Web Vitals (LCP, INP, and CLS) guide you to a fast, smooth, stable site. An SEO expert would tell you the first step is simple: run a PageSpeed Insights test to find weak spots. Try one fix, like compressing a hero image or adding image dimensions. Monitor progress with Search Console. I have seen sites transform, with sales up and bounce rates down, with just a few tweaks. Run a test today, pick one step, and make your site a place visitors love to stay, the kind of result every SEO expert works toward.
FAQs:
What are Core Web Vitals, and why do they matter?
CWV measures loading (LCP), responsiveness (INP), and stability (CLS). They impact SEO and user retention; slow sites lose visitors and rankings.
How do I check Core Web Vitals?
Use PageSpeed Insights for single pages, Search Console for site-wide data, or Lighthouse for tests. GTmetrix or DebugBear adds extra depth.
What causes high LCP, and how do I fix it?
Slow servers, big images, or heavy code delay LCP. Upgrade hosting, use WebP, and minify CSS/JS to hit under 2.5 seconds.
Why is my CLS score high, and how do I lower it?
Missing image sizes, ads, or late fonts cause shifts. Add dimensions, reserve ad space, and preload fonts to keep CLS below 0.1.
What is the difference between INP and FID?
INP tracks all interactions, not just the first, like FID. Fix it by deferring JS, cutting third-party scripts, and shrinking the DOM size.
